New data from the non-profit Angus Reid Institute finds 45 per cent currently support the Democratic candidate in their congressional district, compared with 36 per cent who choose the Republican. Ten per cent remain undecided. Among decided voters, Democrats lead 53 to 43, with four per cent backing another party.
Vote Intent
By State
Enthusiasm
Top Issues
Trust by Issue
State Categories
Methodology
›
Democrats lead by ten points in congressional vote intent
Democratic advantage evident as summer wanes
President Donald Trump has spent August confronting renewed economic pressure at home and escalating challenges abroad, including an intensifying trade dispute with Canada and the continuing war with Iran. At the same time, his administration’s immigration enforcement policies and efforts to tighten rules around mail-in voting have remained prominent political flashpoints. With the full House of Representatives and 35 Senate seats on the ballot Nov. 3, Republicans are increasingly looking to Trump to energize their base, while Democrats are attempting to turn voter concern over prices and the economy into gains in Congress.
Approaching half of would-be voters (45%) say they would support the Democratic candidate in their district, while 36 per cent choose the Republican. Ten per cent are not yet sure, and six per cent either prefer another party or decline to say.
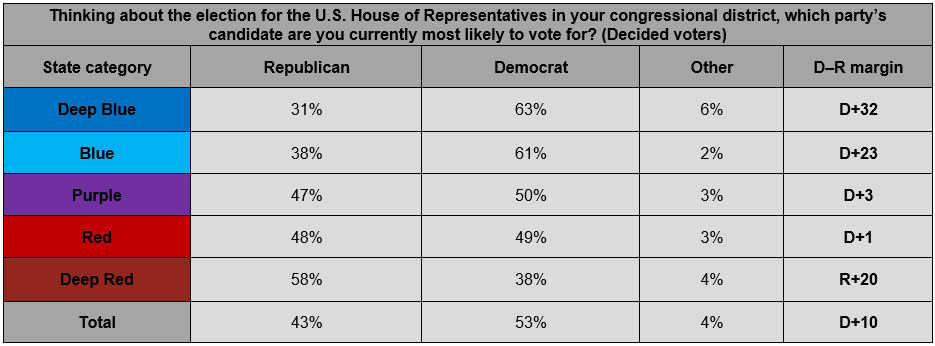
Looking only at voters who have made a choice, the Democratic share rises to 53 per cent, compared with 43 per cent for Republicans. The ten-point Democratic advantage offers an early national measure of the midterm environment, though individual House contests will ultimately turn on district-level candidates and conditions.
A national map of the race
Democrats lead beyond their traditional strongholds
Democratic candidates hold commanding leads in deep blue (63% to 31%) and blue states (61% to 38%), while voters in purple states are nearly evenly divided (50% Democrat, 47% Republican). More strikingly, the divide extends to states that typically lean Republican: in red states, the picture is a statistical tie. Only in deep red states does the GOP retain a substantial advantage, leading Democrats 58% to 38%.
An enthusiasm deficit among non-MAGA Republicans?
MAGA Republicans far more energized than the rest of the GOP
President Trump’s personal approval has dropped throughout his term, hitting lows he did not see in his first four years in office. This, and an unpopular war in Iran, as well as perceived cost of living challenges, may be hampering Republican enthusiasm heading into November.
Overall, nearly half of Americans say they are more enthusiastic about voting in this midterm than in previous ones, while 16 per cent say they are less enthusiastic and 33 per cent feel about the same. That topline masks a sharp divide within the Republican coalition: three-in-five MAGA Republicans report greater enthusiasm (57%), compared with 31 per cent among non-MAGA Republicans. Democrats more closely match the MAGA group, with 53 per cent saying they are more enthusiastic.
Most important issues for likely voters
Cost of living dominates, but priorities shift by state
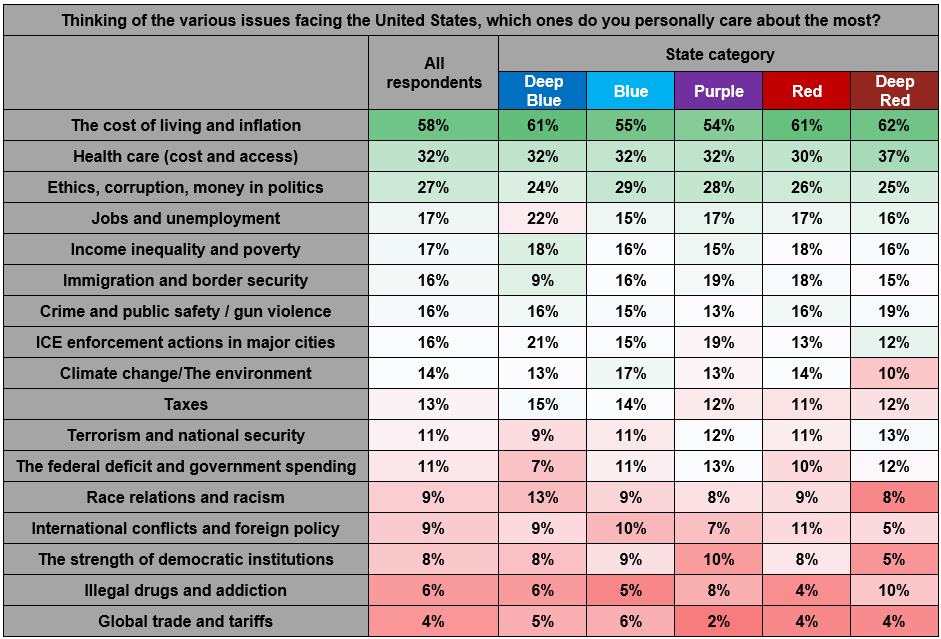
Pocketbook pressure remains the common denominator across the political map. The cost of living and inflation is the most-selected issue in every state grouping, cited by 57 per cent of likely voters overall. Health care costs and access rank second at 33 per cent, followed by ethics, corruption, and money in politics at 29 per cent. Immigration and border security is selected by 18 per cent.
The broad ranking is relatively consistent from Deep Blue through Deep Red states, but some contrasts stand out. ICE enforcement is named by one-quarter (24%) of likely voters in Deep Blue states, while health care reaches 40 per cent in Deep Red states. Crime and public safety is also more prominent in Deep Red states (20%) than in the other state groupings.
Democrats trusted on cost of living and health care, Republicans on immigration, crime
Issue ownership splits along familiar partisan lines
Issue salience does not translate into a uniform partisan advantage. On the top-ranked concern, cost of living and inflation, 39 per cent trust Democrats more, compared with 28 per cent who trust Republicans. Democrats also lead on health care (41% to 25%), jobs and the economy (37% to 32%), and protecting democracy and the rule of law (39% to 27%).
Republicans perform best on immigration and border security, where 39 per cent trust the GOP compared with 31 per cent who choose Democrats, and on crime and public safety, where Republicans lead 34 to 29. Across the issues tested, notable shares also say they trust both parties equally, neither party, or are unsure.
Methodology note
How states were grouped for this report
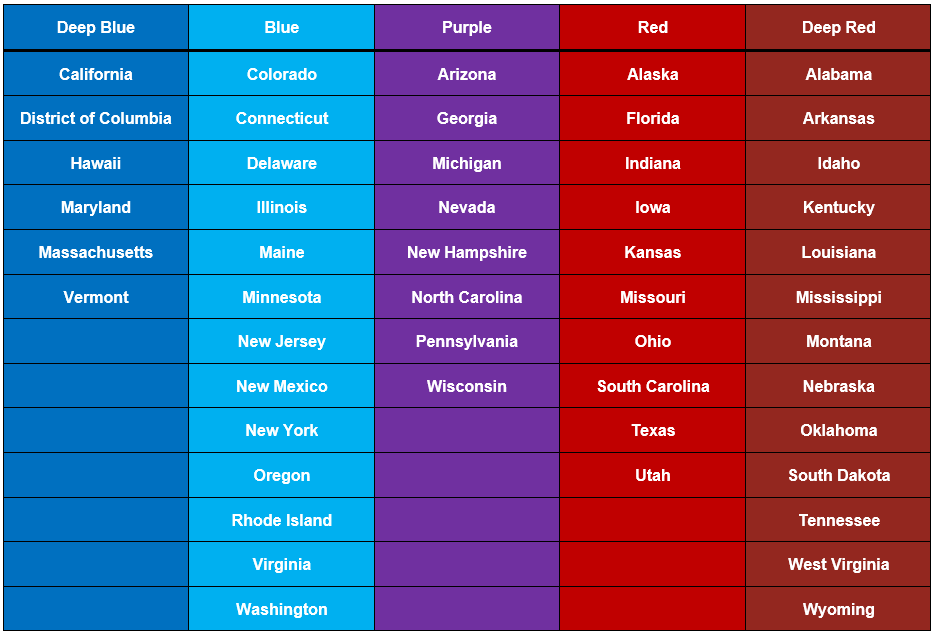
For geographic comparisons in this report, states are grouped into five political categories ranging from Deep Blue to Deep Red, with Purple representing the most electorally competitive states. These groupings are used only to compare issue priorities and vote intent by the broader political character of respondents’ states.
About this survey
Methodology and downloads
Angus Reid USA conducted an online survey from August 8-11, 2026 among a representative randomized sample of 1,525 American adults who are members of Angus Reid Forum USA. For comparison purposes only, a probability sample of this size would carry a margin of error of +/- 2 percentage points, 19 times out of 20. Discrepancies in or between totals are due to rounding. The survey was self-commissioned and paid for by Angus Reid USA.