
Seven-in-ten upset with changes in the cost of living under Trump so far in his term
February 3, 2026 – One year into Donald Trump’s second term as president, Americans are far more likely to say their personal financial situation has worsened than improved.
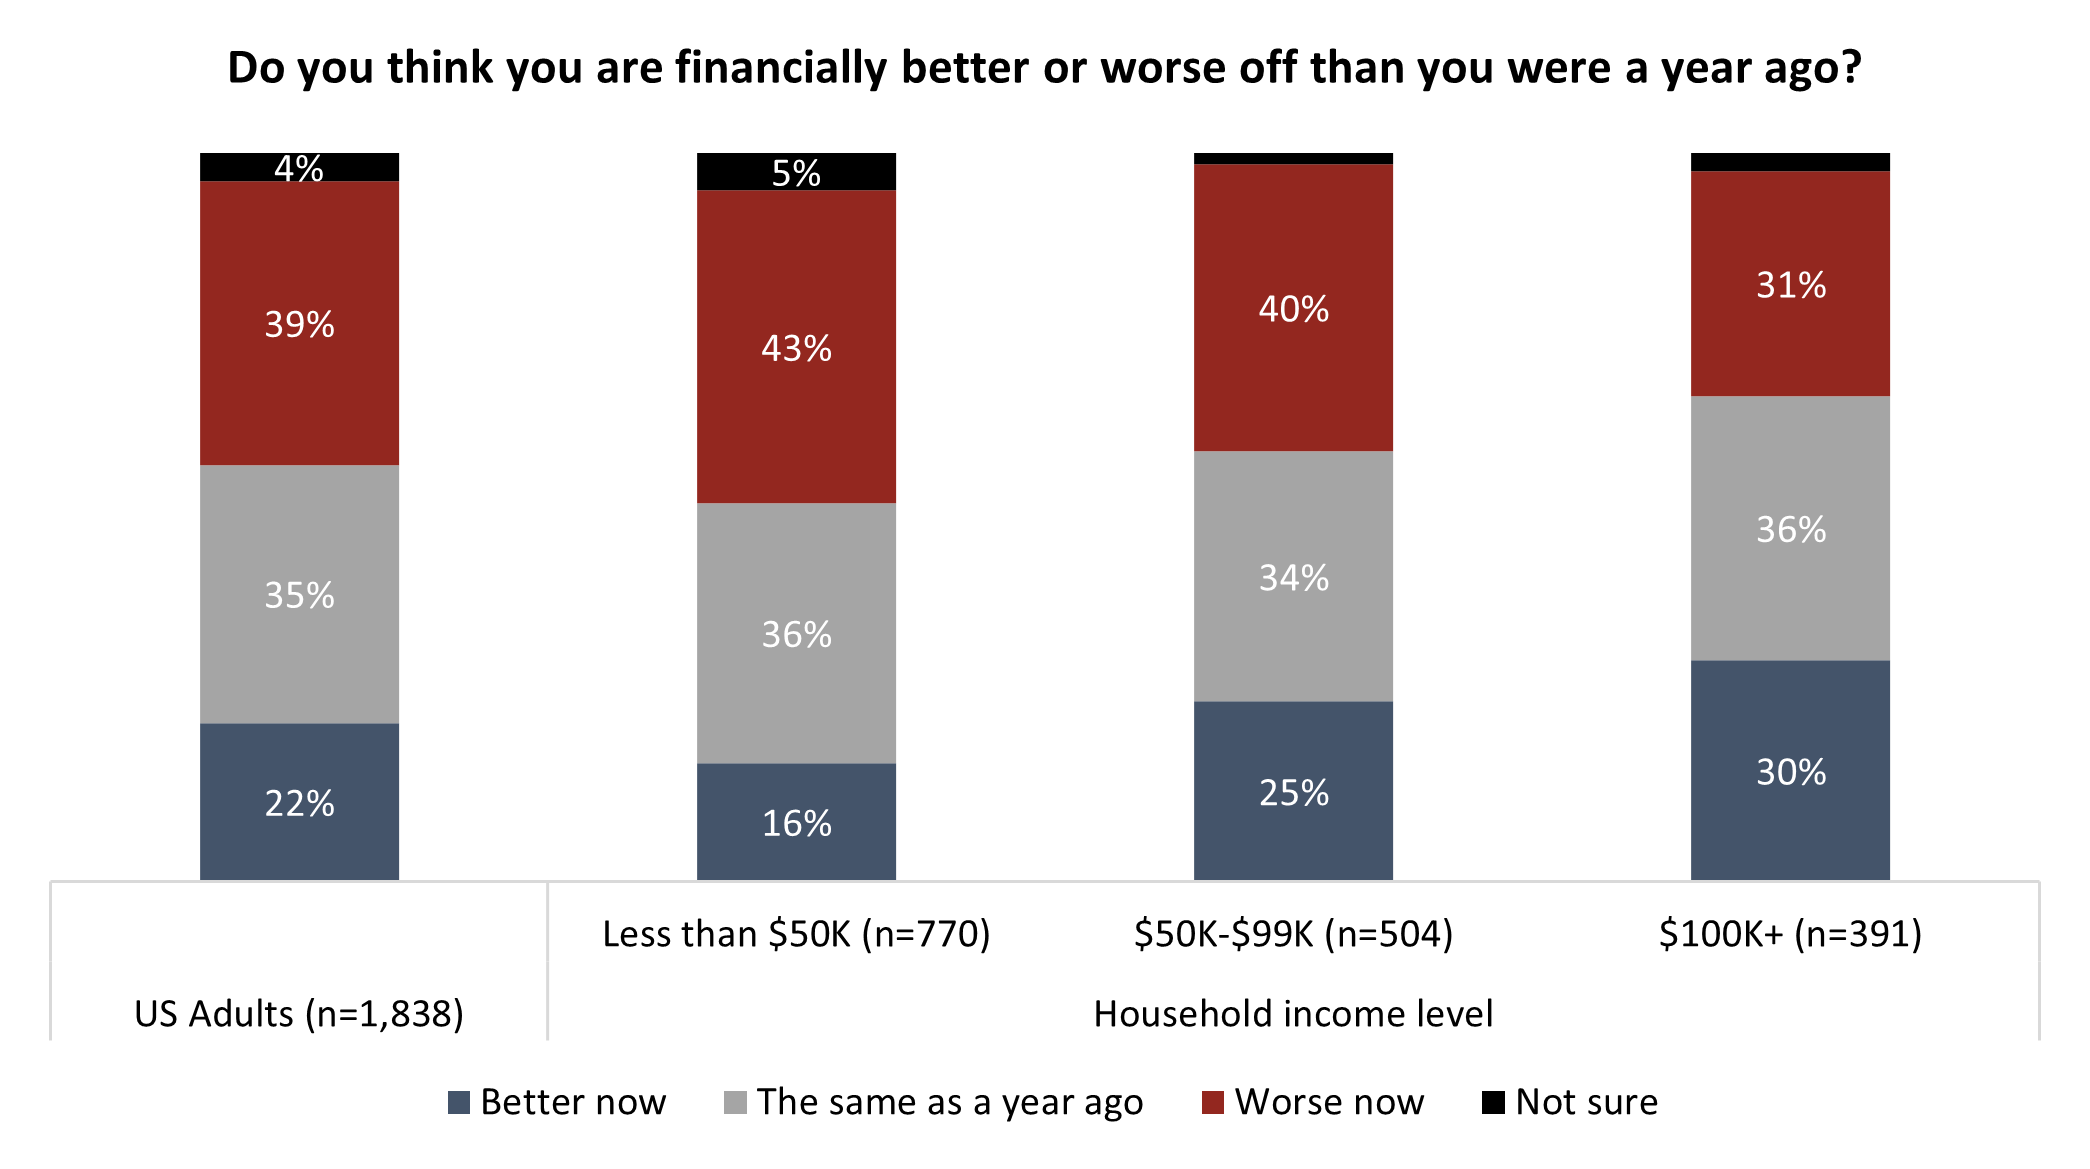
New data from Angus Reid finds that overall, two-in-five (39%) say they are worse off than they were 12 months ago, nearly double the proportion who say they are better off (22%). Another 35 percent say their situation is unchanged, while just four percent are unsure.
This sense of financial backsliding is most pronounced among lower-income households but remains widespread across income brackets. Among those earning less than $50,000 annually, 43 percent say they are worse off, compared to just 16 percent who feel better. Even among high-income Americans earning $100,000 or more annually, nearly one-in-three (31%) say their finances have deteriorated over the past year.
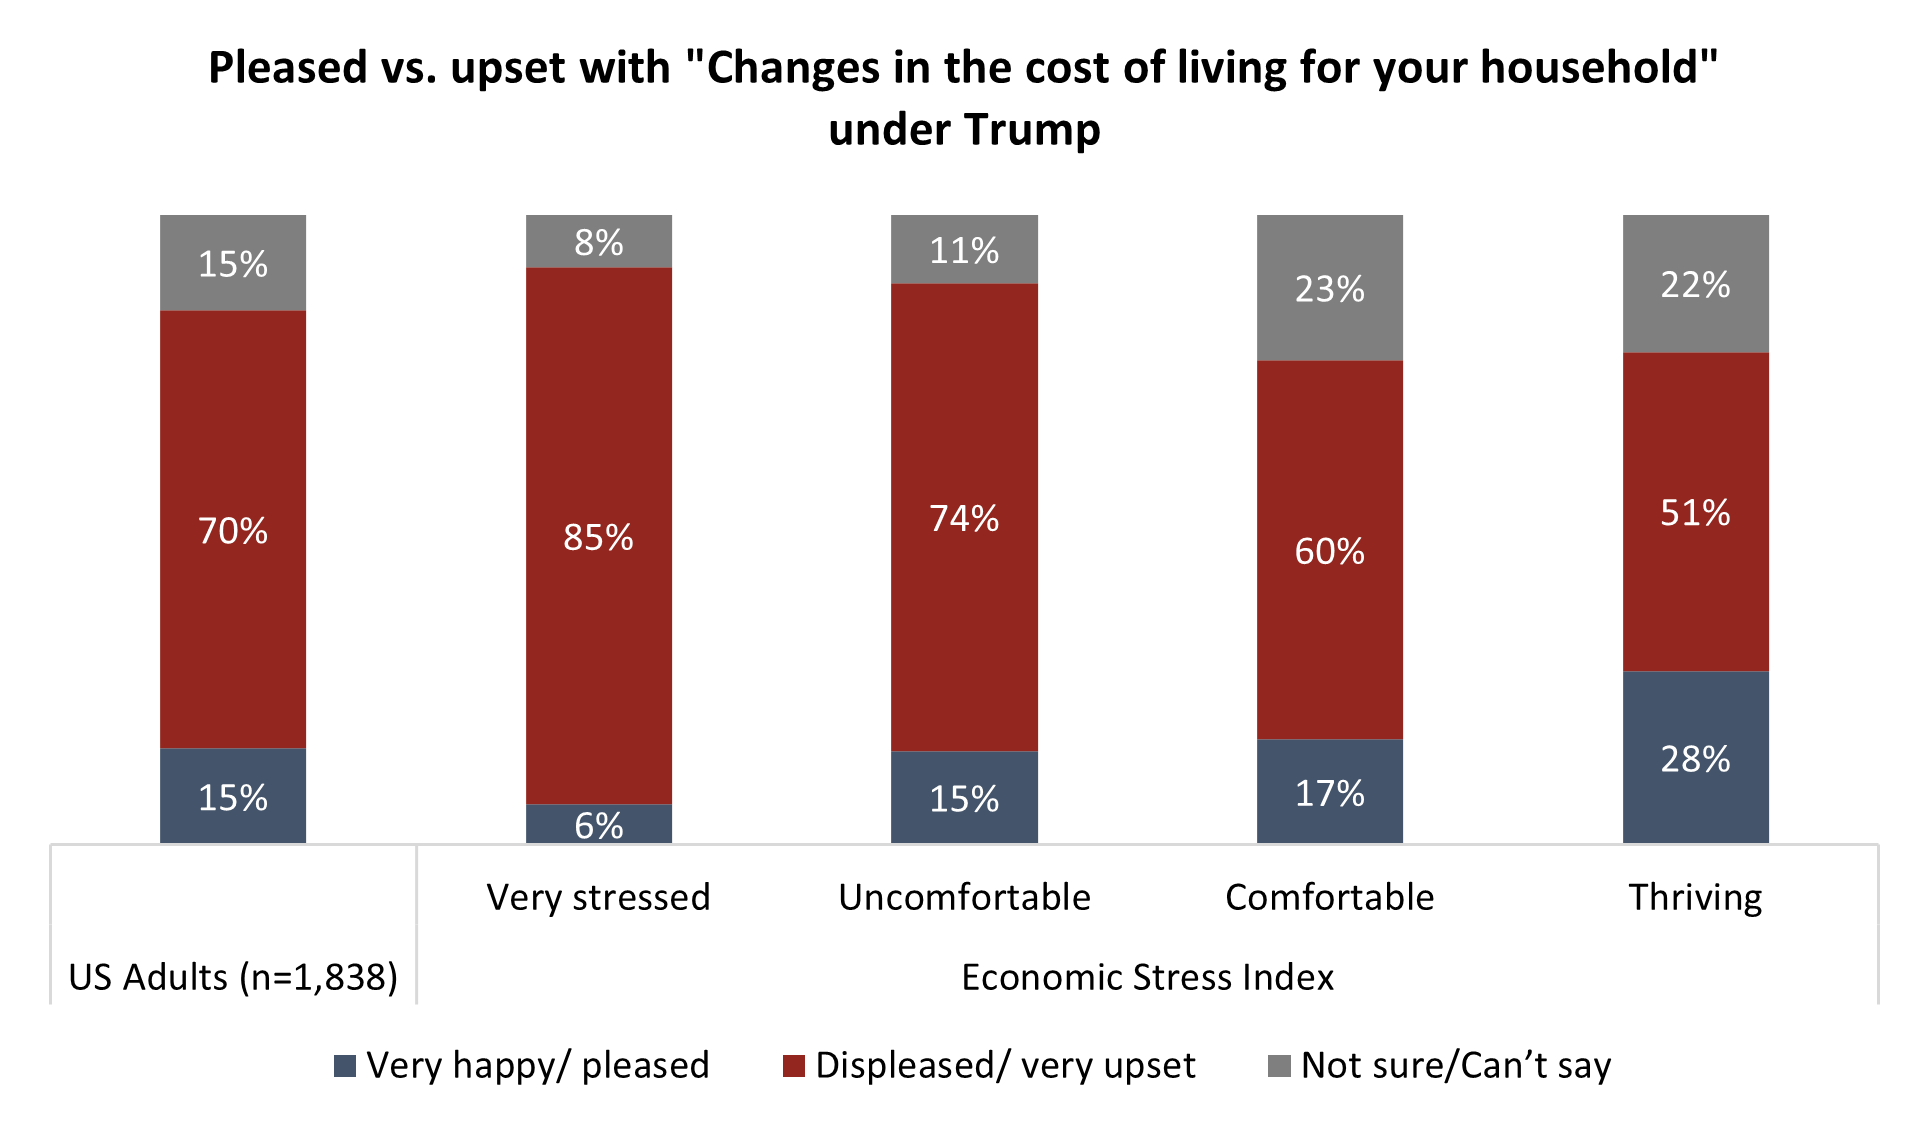
Some of this blame evidently goes to Trump himself, according to Americans. Asked if they are pleased or upset with how he has contributed to cost of living changes over the last 12 months, the vast majority (70%) say they are upset. This included half of those who are “Thriving” on Angus Reid’s Economic Stress Index and rises to 85 percent among those who are worst off, the “Very Stressed”.
More Key Findings:
- Asked how much of a one-time expense they could manage before having to borrow, half of Americans (48%) could withstand $250 or less.15 percent say they’re already too stretched.
- In good news, optimism for the coming year is higher than pessimism. One-in-three (33%) say they expect to be better off one year from now, while 27 percent say they’ll be worse off.
INDEX:
Part One: Financial Update
- Who’s better off or worse off after Trump’s first year?
- Hope outpaces pessimism for the year ahead
- How much of a one-time expense could most Americans handle?
- Three-in-five can’t keep up with cost of living, many worried about job loss
Part Two: Economic Stress Index
- Stock market impact is concentrated on the Comfortable and the Thriving
- Cost of living a major source of criticism
Part One: Financial Update
Who’s better off or worse off after Trump’s first year?
President Trump’s first year saw persistent inflation over the target mark of 2 percent, leading to repeated conflicts with Fed Chair Jerome Powell, as Trump pushes the independent body to lower interest rates. This, as wage growth decelerated.
Across the income spectrum, negativity outpaces positivity when Americans reflect on their financial trajectory over the past year. Middle-income households earning between $50,000 and $99,000 annually are split, with 40 percent saying they are worse off and 25 percent better off, while roughly one-third (34%) say they are about the same as last year.
High earners remain the most likely to report improvement, but even here the picture is mixed: three-in-ten (30%) of those earning $100,000 or more say they are better off, while a similar share (31%) say they are worse off. The result is a broad-based sense that financial conditions have stagnated or declined for many Americans, regardless of household income.
Hope outpaces pessimism for the year ahead
Despite widespread dissatisfaction with the past year, Americans remain cautiously optimistic about the future. One-third (33%) believe they will be financially better off a year from now, compared to 27 percent who expect to be worse off and 26 percent who anticipate no change. Thirteen percent say they are unsure.
Optimism increases with income. Two-in-five (40%) high-income Americans expect improvement over the next year, compared to just 30 percent of those earning less than $50,000 annually. Still, even among lower-income households, optimism slightly outweighs pessimism, suggesting that while many feel bruised by the past year, a significant share is hopeful that their fortunes may improve.

How much of a one-time expense could most Americans handle?
Financial fragility remains a defining feature of the American economic experience. While just over one-quarter (27%) say they could handle an unexpected expense of more than $1,000 this month, a majority would struggle with even modest financial shocks.
Nearly half say they could manage no more than $250, including 19 percent who could only handle up to $100 and 15 percent who say they could not manage any unexpected expense at all because they are already too financially stretched. Another 12 percent could manage up to $500, while 13 percent could handle between $500 and $1,000.
These findings point to limited financial resilience for large segments of the population, leaving many vulnerable to sudden costs such as car repairs, medical bills, or household emergencies.

Three-in-five can’t keep up with cost of living, many worried about job loss
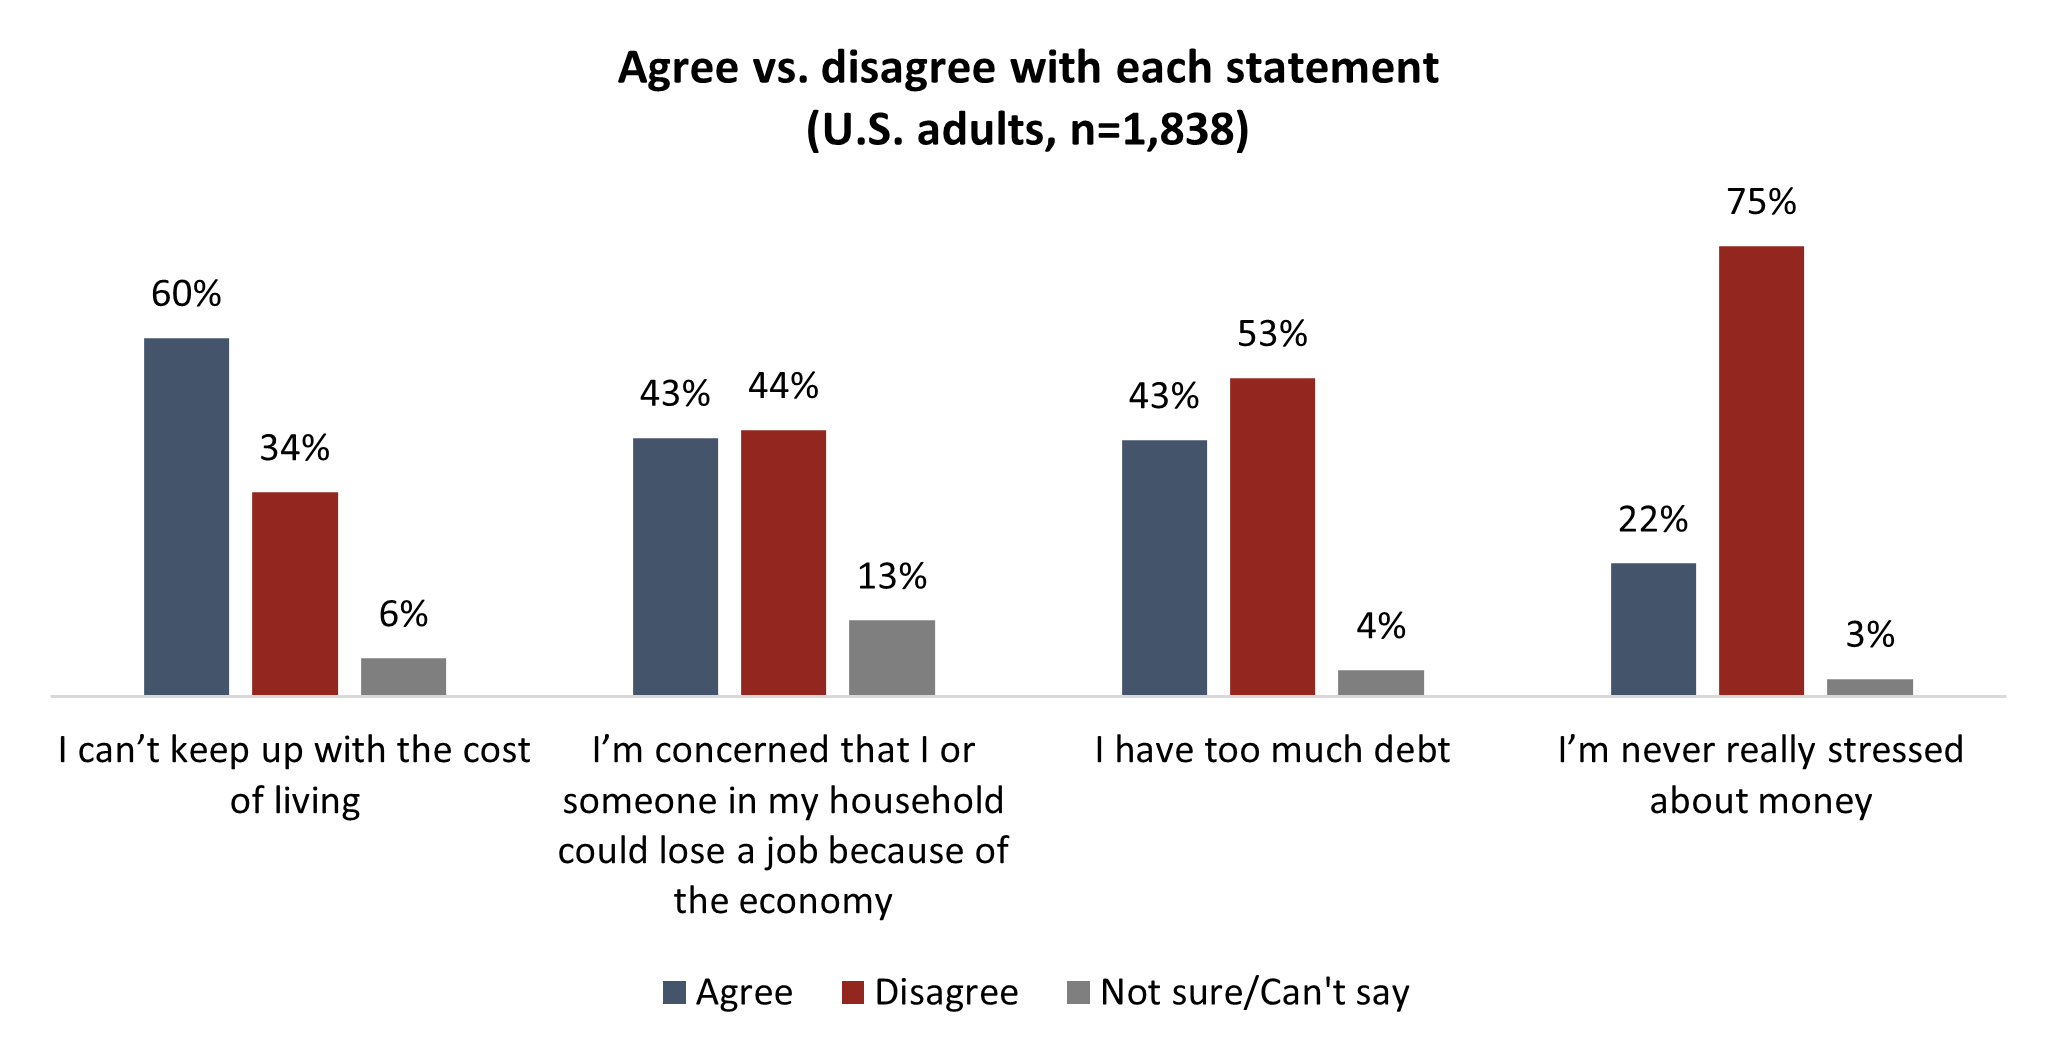
Cost pressures continue to dominate Americans’ economic concerns. Three-in-five (60%) agree that they cannot keep up with the cost of living, while just 34 percent disagree. Meanwhile, 43 percent say they are concerned that they or someone in their household could lose a job because of the economy, compared to 44 percent who are not concerned.
Debt also weighs heavily on many households. More than two-in-five (43%) say they have too much debt, while a majority (53%) disagree. Notably, only 22 percent say they are never really stressed about money, underscoring the prevalence of financial anxiety even among those who are managing day-to-day expenses.
Part Two: Economic Stress Index
To understand the depth of challenge faced by some, Angus Reid created the Economic Stress Index. This is a measure of variables scored positively for economic comfort and negatively for economic stress. For more on the scoring, click here.
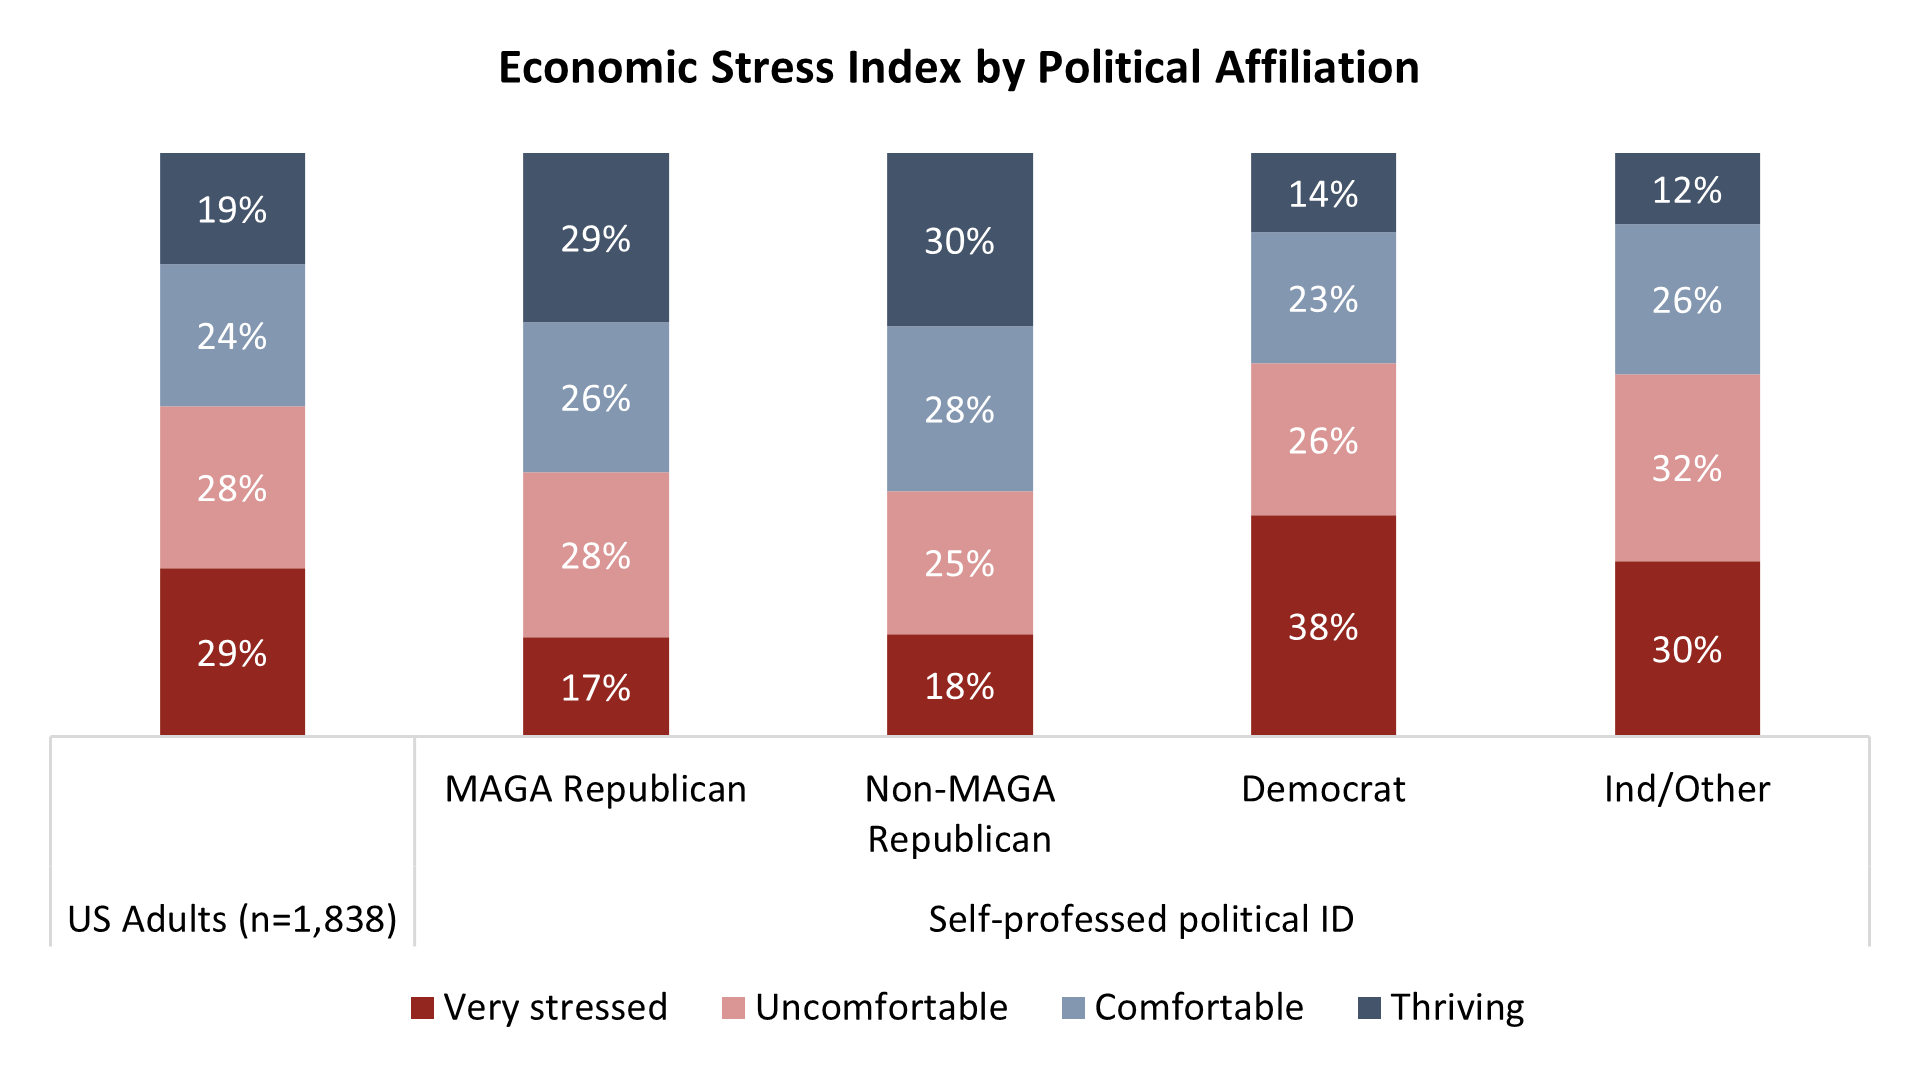
Economic stress varies sharply by both income and political identity. Overall, three-in-ten Americans (29%) fall into the “Very Stressed” category of the Economic Stress Index, while another 28 percent are “Uncomfortable.” One-quarter (24%) are “Comfortable,” and just under one-in-five (19%) are considered “Thriving.”
Lower-income households are far more likely to experience acute stress. Among those earning less than $50,000 annually, two-in-five (40%) are very stressed and only 11 percent are thriving. In contrast, among those earning $100,000 or more annually, just 12 percent are very stressed, while one-third (33%) are thriving.

Political identity also shapes economic experience. Democrats are the most likely to be very stressed (38%), followed by Independents and others (30%). MAGA Republicans are the least likely to report high stress (17%), and the most likely to say they are thriving (29%).
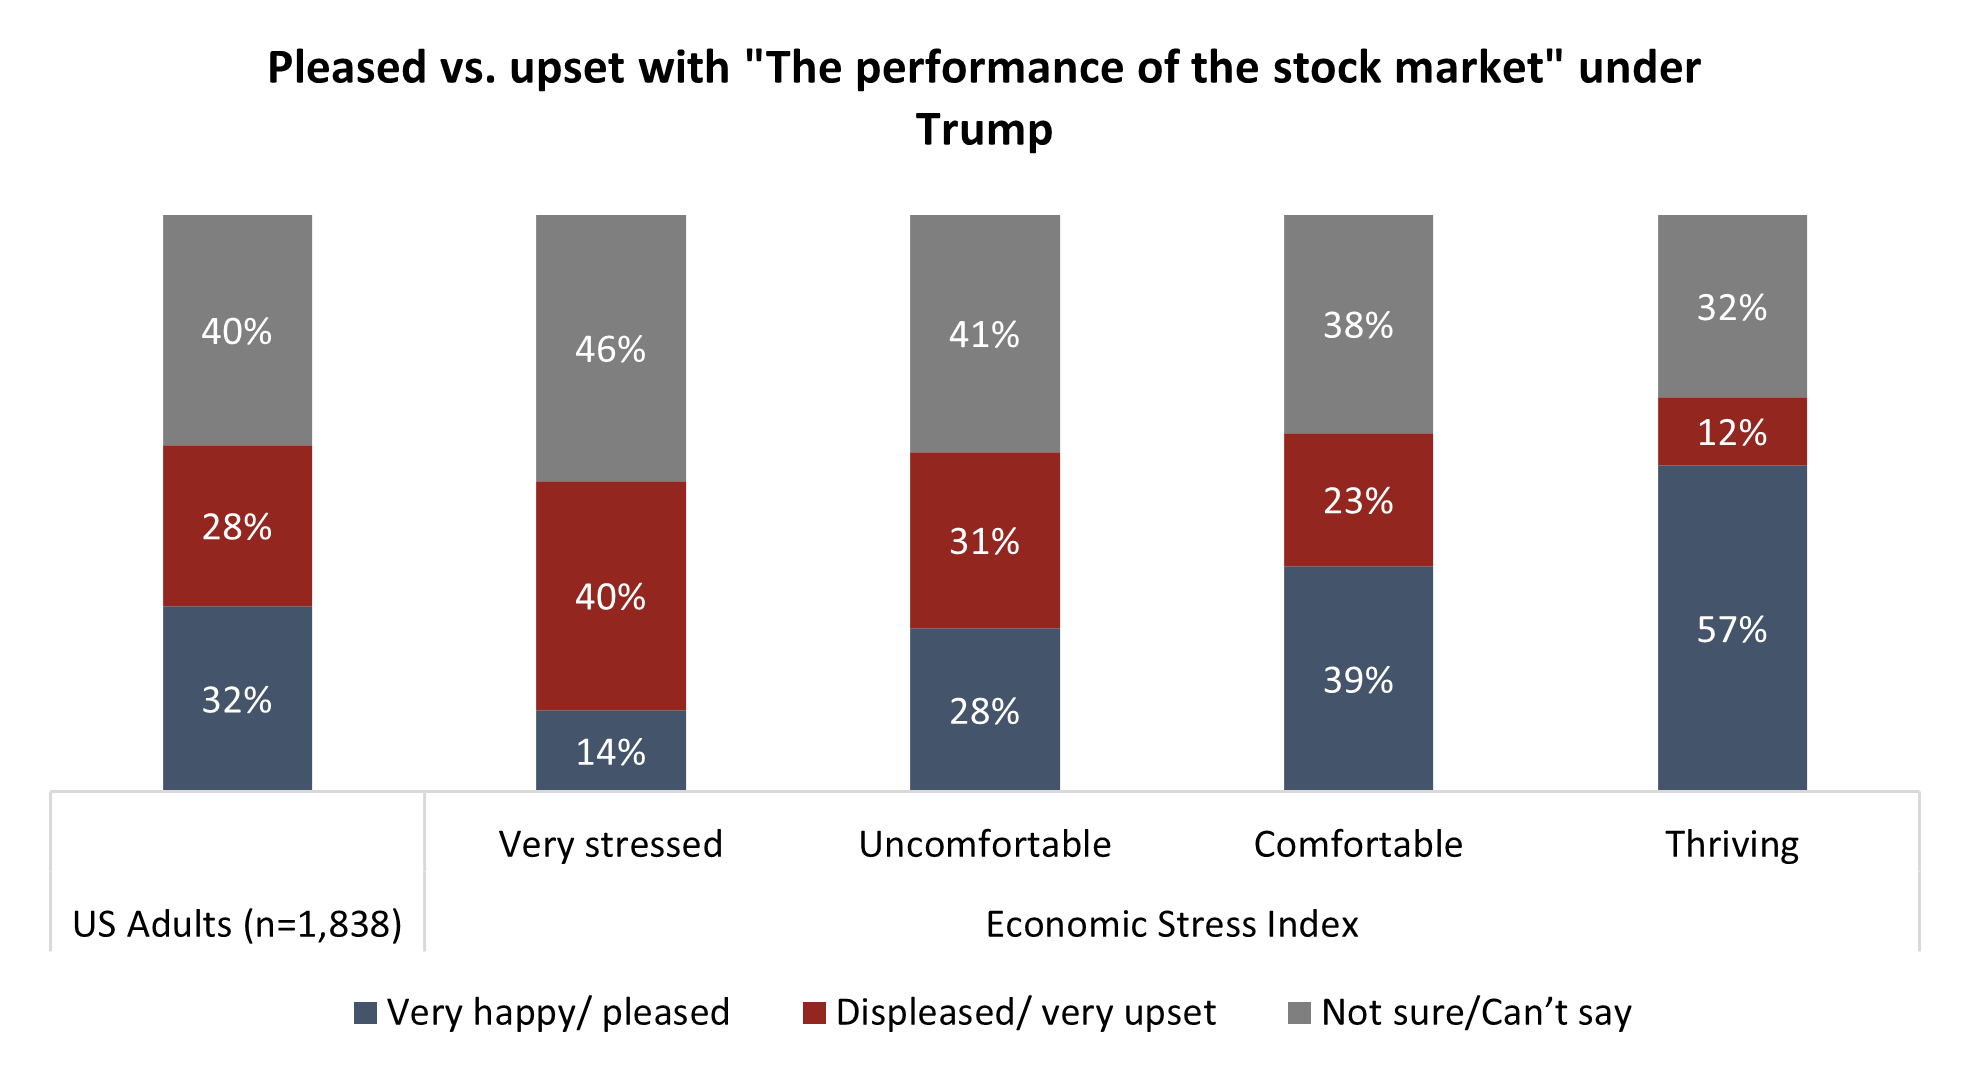
Stock market impact is concentrated on the Comfortable and the Thriving
Views of Trump’s economic performance diverge sharply depending on financial standing. Among those who are thriving, a majority (57%) say they are very happy or pleased with the performance of the stock market under Trump. This drops to 39 percent among the comfortable, 28 percent among the uncomfortable, and just 14 percent among the very stressed.
Cost of living a major source of criticism
When it comes to cost of living, dissatisfaction dominates across every group. Seven-in-ten Americans (70%) say they are displeased or very upset with changes in the cost of living under Trump. This rises to 85 percent among the very stressed and remains a majority even among the thriving (51%). Only 15 percent of Americans overall say they are pleased with cost-of-living changes.
Taken together, the findings suggest that while stock market gains are being felt primarily by those already in strong financial positions, rising living costs are a nearly universal source of frustration, cutting across income and stress levels alike.
METHODOLOGY
Angus Reid USA conducted an online survey from January 16 – 20, 2026, among a randomized sample of 1,838 American adults who are members of Angus Reid Forum USA. The sample was weighted to be representative of adults nationwide according to region, gender, age, household income, and education, based on the U.S. census. For comparison purposes only, a probability sample of this size would carry a margin of error of +/- 2 percentage points, 19 times out of 20. Discrepancies in or between totals are due to rounding. The survey was self-commissioned and paid for by ARUSA. Detailed tables are found at the end of this release.
For detailed results by age, gender, region, education, and other demographics, click here.
For PDF of full release, click here.